Advanced Spatial Analysis Techniques
Reading time
Content
Zonal Statistics
Zonal statistics is a spatial analysis technique used in GIS to summarize the values of a raster dataset within the boundaries of defined zones. The zones are typically defined by a vector dataset, such as polygons (e.g. administrative boundaries, watersheds) or raster cells with identical values. The goal of zonal statistics is to calculate statistical measures (e.g. mean, sum, minimum, maximum) for the raster values that fall within each zone.
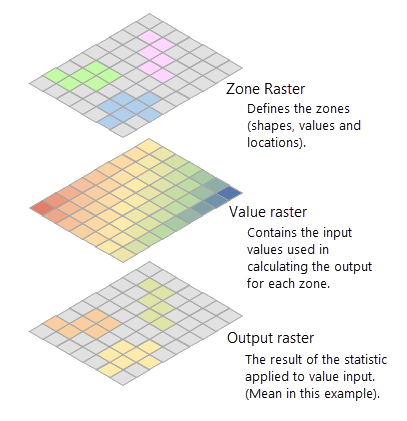
The principle of zonal statistics with zones defined by raster data. Source: https://pro.arcgis.com/en/pro-app/latest/tool-reference/spatial-analyst/how-zonal-statistics-works.htm
Zonal Statistics Exercise: Assessing Vegetation Health
Problem to Solve: Assess vegetation health in different regions using vegetation index data (e.g. NDVI).
Data Needed:
- Vector data: Regions or land use zones (e.g. protected areas, farming regions).
- Raster data: NDVI (Normalized Difference Vegetation Index) or other vegetation indices.
Tools in QGIS:
- Zonal Statistics: Use the "Zonal Statistics" tool to calculate the average NDVI value within each region or land use zone.
- Symbology: Color-code the regions based on NDVI to highlight healthy vegetation areas and those that may require attention.
Cluster Analysis
Cluster analysis is a statistical and spatial analysis technique used to group a set of objects or observations into clusters or groups based on their similarity or proximity. In GIS, it is often employed to identify patterns, trends, or concentrations in spatial data by analyzing the locations or attributes of features. Cluster analysis can reveal natural groupings, such as crime hotspots, disease outbreaks, or customer demographics. Methods include hierarchical clustering, k-means clustering, and density-based clustering (e.g. DBSCAN). These techniques can be applied to points, polygons, or attributes and are widely used in fields like urban planning, public health, market analysis and environmental studies.
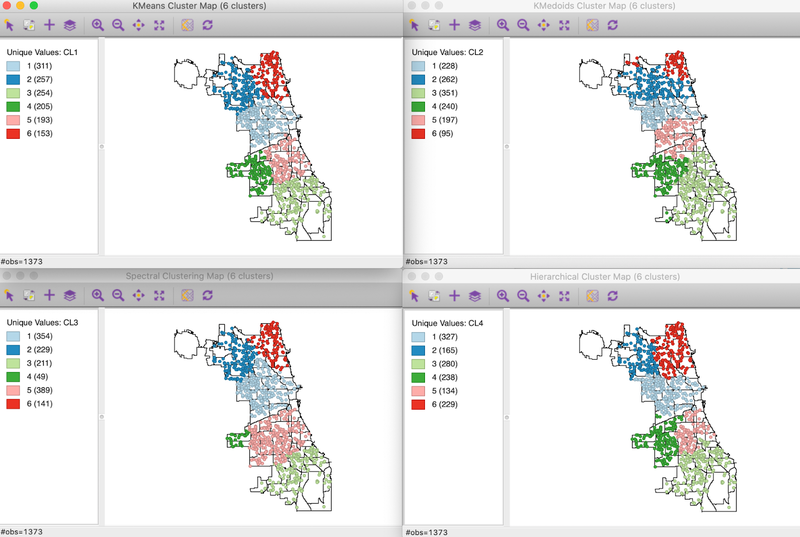
Points divided into 6 clusters by the k-means clusters method. Each result reflects different input parameters of the k-means method. Source: https://geodacenter.github.io/workbook/9a_spatial1/lab9a.html
Cluster Analysis Exercise: Temperature Anomalies and Heat Islands
Problem to Solve: Detect urban heat islands or areas experiencing unusual temperature anomalies, which can be used to plan urban cooling strategies.
Data Needed:
- Temperature data (either from ground stations or remotely sensed data like MODIS or Landsat).
- Urban land cover or population data for context.
Tools in QGIS:
- K-Means Clustering: Identify clusters of areas with higher-than-average temperature anomalies.
- DBSCAN: Use for detecting areas with high-density temperature anomalies.
- Raster Calculator: Combine temperature data with urban land cover data to identify temperature hotspots.
- Symbology: Style the clusters to highlight areas with the most significant temperature differences.
Surface Analysis
Surface analysis is a spatial analysis technique used to study and interpret continuous data represented as a surface, typically through raster datasets. It involves analyzing variations across the surface to understand trends, patterns or relationships within the data. Common surface analysis operations include calculating slope and aspect (to study terrain), identifying high and low points (peaks and depressions) and performing viewshed or visibility analysis. These techniques are widely applied in fields like environmental modeling, urban planning, and hydrology. For example, surface analysis can help predict water flow across a landscape, model solar radiation exposure or assess the visibility of landmarks from specific vantage points.
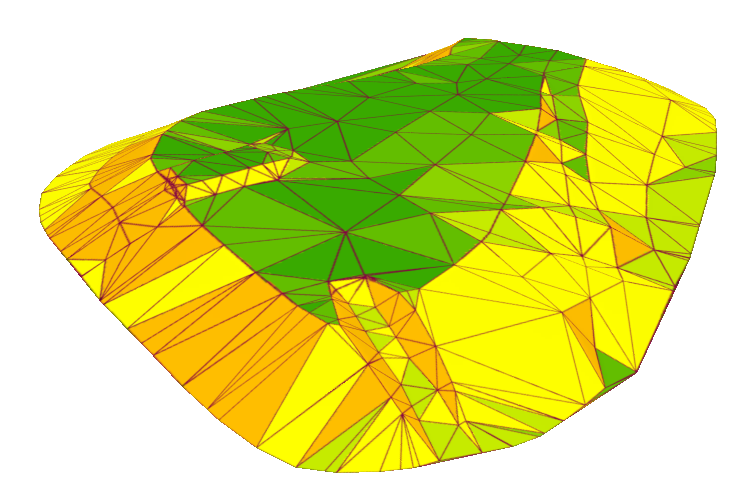
Surface created by triangulated irregular network (TIN) symbolised by its slope.
Surface Analysis Exercise: Identifying Suitable Areas for Solar Panel Installation
Problem to solve: Identify areas suitable for solar panel installation based on terrain characteristics such as slope and aspect. Locations with an optimal slope and south-facing aspect are preferred for maximum solar energy capture.
Data needed:
- Raster Data: Digital Elevation Model (DEM) of the study area.
- Vector Data (optional): Boundary shapefile for the area of interest (e.g. municipality boundary).
Tools in QGIS:
- Slope: To calculate terrain slope from the DEM.
- Aspect: To determine terrain orientation.
- Raster Calculator: To apply suitability criteria.
- Reclassify by Table: To categorise slopes and aspects into suitability classes.