Types of Maps
Reading time
Content
Maps can be divided into two major groups: Reference (base) maps and thematic maps. The primary difference between reference maps and thematic maps is in their purpose and the information they convey.
Reference maps are designed to show the location of geographic features, such as boundaries, cities, and physical landscapes, providing a general understanding of an area’s layout; examples include political, physical, and topographic maps.
In contrast, thematic maps highlight a specific theme or topic over a geographic area, such as temperature, population density, or resource distribution, by overlaying this data onto a base map. While reference maps emphasise locations and boundaries, thematic maps focus on communicating patterns or trends related to a particular subject.
Physical maps are designed to show the natural landscape features of Earth. They are best known for showing topography, either by colours or as shaded relief.
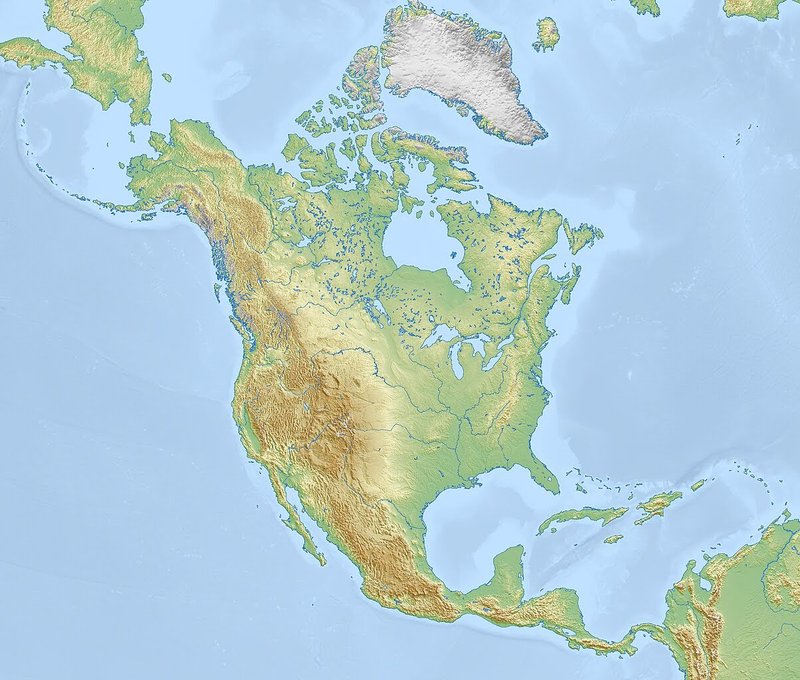
Physical map of North America, Mapswire / CC-BY 4.0
Political maps are among the most widely used reference maps. They show the geographic boundaries between governmental units such as countries, states, and counties. To distinguish the governmental units, each unit is painted in a different colour. Political maps may show roads, cities and major water features such as oceans, rivers and lakes. Political maps help people understand the geography of the world. They are mounted on the walls of classrooms throughout the world and they are usually the first type of map that students are introduced to in school.
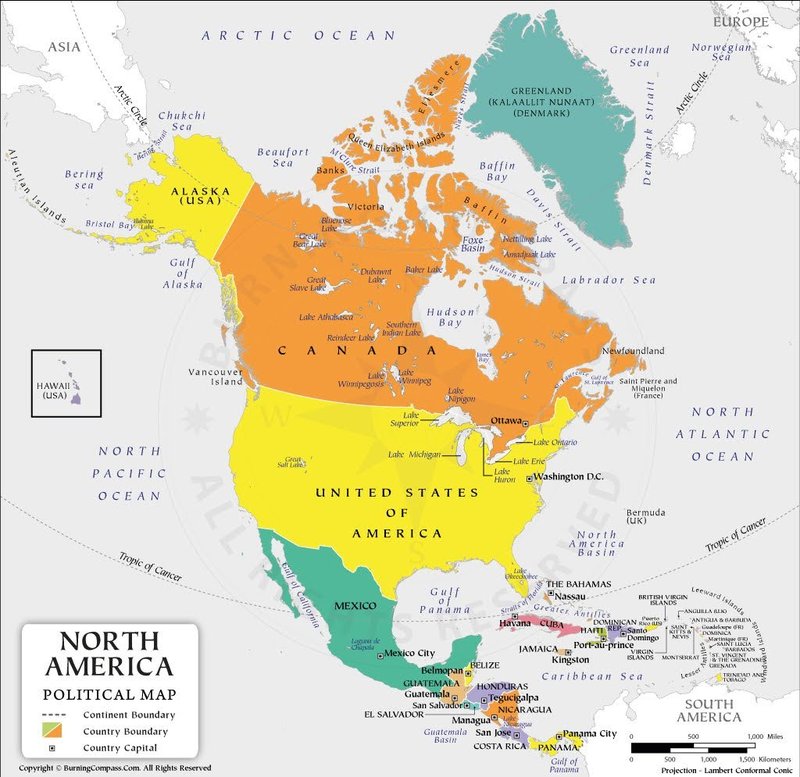
Political map of North America. Source
Topographic maps are reference maps that show the shape of Earth’s surface. They usually do this with lines of equal elevation known as "contour lines", but elevation can also be shown using colours (second map), colour gradients, shaded relief and a number of other methods. Topographic maps also show other important natural features such as lakes, rivers and streams. Important cultural features are also shown on topographic maps. These include roads, trails, buildings, place names, bench marks, cemeteries, churches, schools and much more. A standardised set of special symbols has been developed for this use. Topographic maps have traditionally been printed on large sheets of paper with their four boundaries being lines of longitude and latitude.
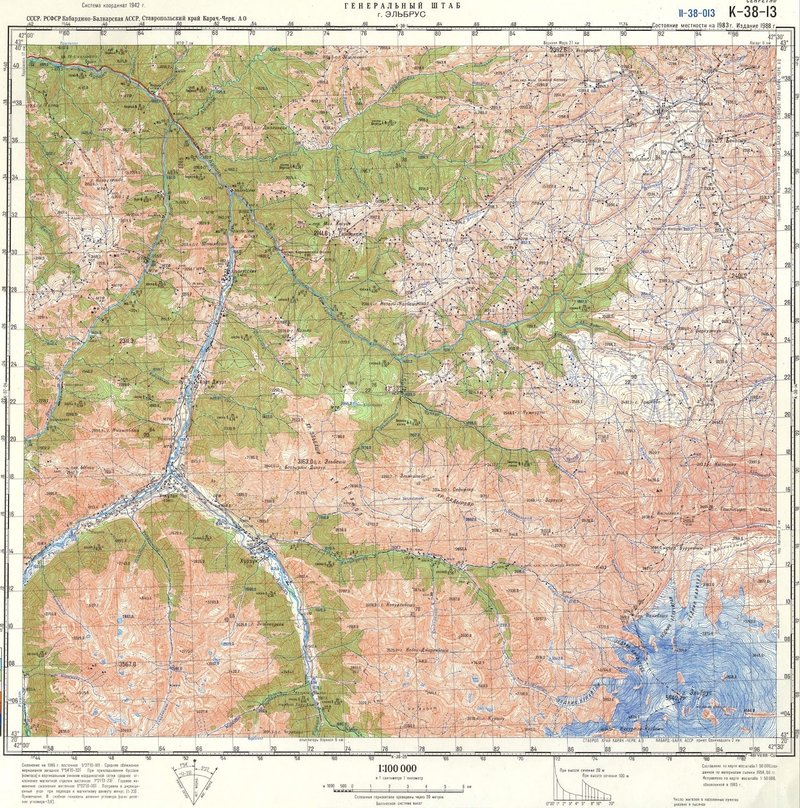
Soviet military mapping – topographic map of the Elbrus mountain. Source
An orthophotomap is a high-resolution aerial photograph that has been geometrically corrected, or "orthorectified," so that it accurately represents the Earth's surface, with uniform scale throughout. Unlike standard aerial photographs, which can have distortions due to camera angles, terrain, or elevation, orthophotomaps align with a specific map projection, allowing for precise measurements of distance, area, and angles directly from the image. These maps combine the visual detail of a photograph with the spatial accuracy of a map, making them useful for applications in urban planning, environmental monitoring, and geographic analysis.
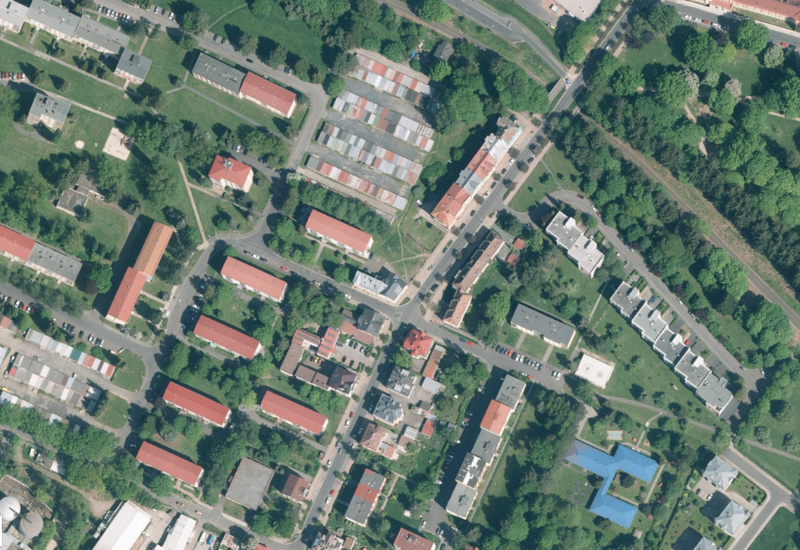
Orthophotomap of a town in Czechia.
A thematic map is a type of map that portrays the geographic pattern of a particular subject matter (theme) in a geographic area. This usually involves the use of map symbols to visualise selected properties of geographic features that are not naturally visible, such as temperature, language, or population.
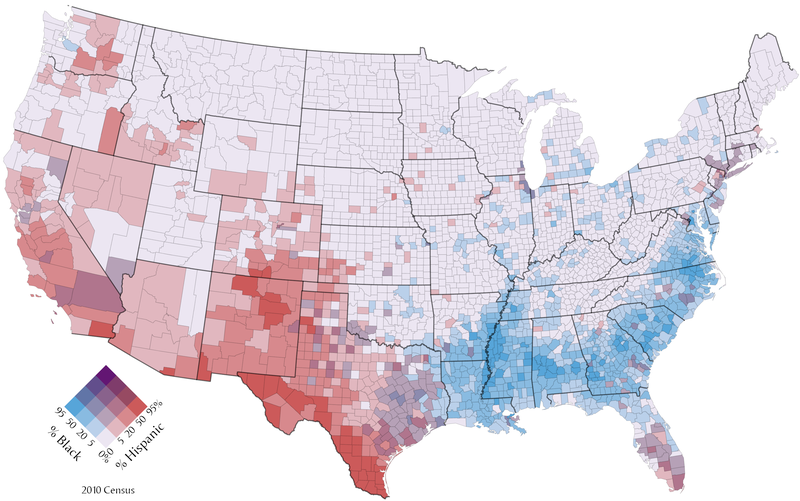
A thematic (choropleth) map visualising proportion of black and hispanic population in the United States as of 2010. Bplewe / CC-BY-SA 4.0
Sources
Source for this lecture: https://geology.com/maps/types-of-maps