Geodata
Reading time
Content
About Geodata
Geodata are the lifeblood of GIS; without it, GIS has nothing to process, analyse, or visualise. Geodata itself carry two types of information: spatial and thematic. The spatial information contains the position, referred to a given reference system, and it answers the question “where?”. The thematic information answers the question “what?” and it defines the characteristics of the phenomenon or feature that occurs at the location indicated by the spatial component.
An important concept to consider related to geographical information is the dimension. The elements that we store range from simple points (0D), to three-dimensional volumes (3D).
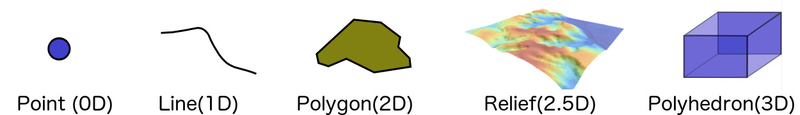
Geodata with different dimensions as commonly represented in GIS. Source: OLAYA, Víctor. Introduction to GIS. 2018, CC-BY.
In a GIS, the information about a given study area is divided into several levels. Even if it refers to the same location, the information about different phenomena is stored separately. That is, a set of different blocks of information
exists for the same area, each of them containing a particular variable or set of elements. Each of these blocks is called a layer. The concept of layer is fundamental to understand GIS and helps to correctly structure and manage geographical information. All the geodata that you will use in a GIS will be in the form of layers. Each one of them can be used independently or together with others.
The main feature of a GIS to transparently integrate data corresponding to different areas and create a seamless
mosaic is the separation between the data and its visualisation. Data is required for visualisation, but these two perspectives constitute different parts of a GIS, with a clear separation between them. That means that data is used to create a visual output, but data itself does not contain any value related to its rendering and visualisation. Thus, it is possible to combine data and then represent that combination together as a whole.
Geodata Models
Geodata in GIS can be represented in various models. A representation model is a way of coding the concept into a finite set of elements. Two main representation models are the raster model and the vector model. Layers using these models are commonly known as raster layers and vector layers.
The most common raster model is based on a grid of square cells, often called pixels. Generally, pixels can carry any type of information, but most commonly its value is a numeric value or a set of numeric values. If the values are numerical, the raster layer can be seen as a matrix and the corresponding mathematical tools can be used for its analysis. The number of values stored in each pixel defines the number of bands of that raster layer. Images taken with a digital camera are a great example. In a colour image, each pixel carries three values: those for red, green and blue colour. Hence, an image like that has three bands. An image can sometimes be converted into a greyscale image, in that case, it would have only one band, and the value would represent the saturation of grey (from white to black). Another typical use of the raster model is for the Digital Elevation Models (DEM), which describe the topography of a certain area. DEMs are always single band layers.
Raster model is also suitable to represent objects in three dimensions. A 3D cell, an analogy to a pixel in 2D, is a cube cell, sometimes called voxel.
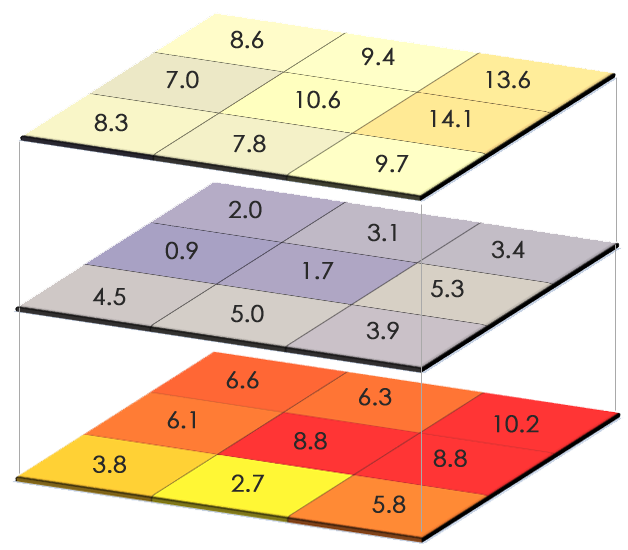
An illustration of a raster layer with 3x3 pixels (9 cells) and three bands. Source: GIS Geography, https://gisgeography.com/spatial-data-types-vector-raster
In the vector model, there are no fundamental units like cells that divide and cover the modelled area. Instead, the geometry and characteristics of the described elements is modelled using features. Features carry two kinds of information:
- geometry, which is the spatial information, and
- attributes, which is the thematic information.
A layer usually contains multiple attributes. Attributes are associated with features, can have information of all types and they are more versatile than the values associated with raster layers, which normally contain just numerical values. Due to its particular structure (a set of attributes associated with a feature), the thematic component in the vector model can be represented as a table and stored in a database. Also, it can be analysed independently of the spatial component.
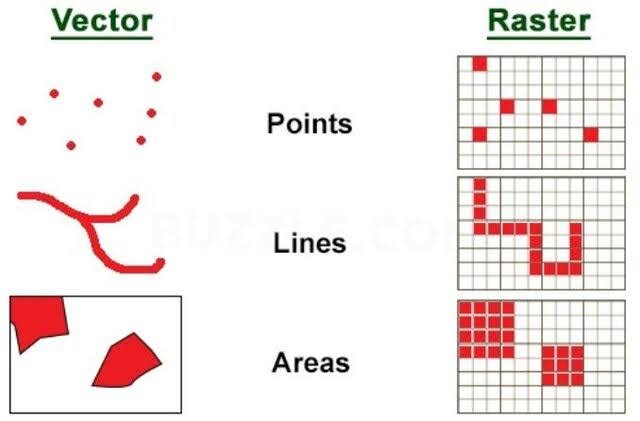
Comparison of features with different geometries represented in both vector and raster models. Source: Polat, Zeynel & Alkan, Mehmet. (2019). Design and Develop GIS for Regional and Urban Planning.
Both the raster and vector representation models can be used to store any geographical information. Digital elevation models (DEMs) are a typical case of raster layers. Representing elevation as a raster layer has many advantages, especially for performing analysis, but it is not the only option. We can have a vector layer with points (that will be the case if the elevation data comes for a topographic survey), or a lines layer with contour lines (the most common way of representing elevation in a traditional map). Overall, there is no representation model that is better than the other. Depending on the case, one will be more suitable than the other.
In general, it is better to use raster layers for continuous variables such as elevation, in order to make it easier to perform analysis based on them. Discrete variables, on the other hand, are better represented using a vector approach.
There are algorithms that allow converting between the raster and vector representation models, so if we have our data in one of them, we can obtain a new layer that uses the other model and might be more suitable for our work.
Geodata Formats
Both raster and vector data can be stored in various formats, which differ in their internal structure, readability, capabilities, size and interoperability. Some widely used formats used for geodata are:
- GeoJSON (vector): A lightweight JSON-based format for storing simple geographical features, commonly used for web mapping applications.
- Shapefile (vector): An older, widely-used ESRI format that stores geographic features as separate files (e.g., .shp, .shx, .dbf) but lacks support for advanced data types and metadata.
- GeoPackage (vector and raster): A modern, single-file SQLite-based format that supports complex geodata and attributes, designed for efficient data storage and mobile use.
- KML (vector): An XML-based format used mainly for displaying geographic data in Google Earth, focusing on presentation rather than complex data types.
- GML (vector): A versatile XML-based format that supports complex geographic features, often used in interoperability for diverse GIS systems.
- GPX (vector): A format primarily for GPS data, storing waypoints, tracks and routes, optimised for navigation devices.
- TIF (raster): A high-quality raster format supporting georeferencing (GeoTIFF), commonly used for satellite imagery and detailed maps.
- JPG (raster): A widely-used compressed image format without native georeferencing, often used for simple visual maps but not for analytical GIS work.
- TXT (vector or raster): A basic text format that can contain geographic coordinates or attribute data in a simple, unstructured form, often used for quick data sharing.
- CSV (vector or raster): A plain-text format that stores data in a table structure, commonly used for attribute data and simple geographic coordinates (like latitude and longitude), but lacks built-in support for complex geospatial structures or metadata.
Creating and Editing Vector Data in QGIS
Creating a new vector layer in QGIS is straightforward. In the menu under “Layer” select “Create Layer”. From the options given there, choose a proper format for the layer to be created. If uncertain, use Geopackage, which is suitable in most of the cases. Temporary Scratch Layer can be also useful if you want to experiment. Temporary Scratch Layer is deleted once you close QGIS, but it can be made permanent (saved to the drive), if necessary.
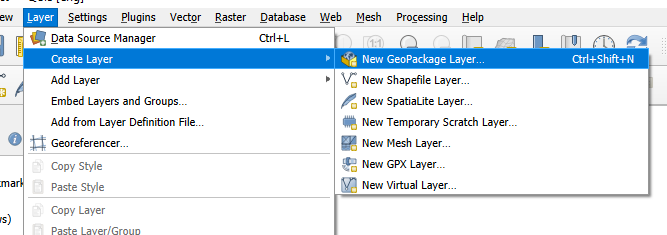
The menu in QGIS for creating a new vector layer.
If you are creating a new permanent layer (Geopackage, Shapefile, etc.) you have to specify a location in which you like to store the geodata. Then you should select a geometry of features you want to create in this layer. Traditionally, one layer only contains one type of geometry for all features. You must also specify a spatial reference system in which the geometry will be represented. WGS84 is a world-wide acceptable option, but as it is a geographic coordinate system, it has its limits in accuracy and in the calculation of areas or volumes. A local projected spatial reference system must be selected if a higher precision of coordinates is needed. In this step you can also specify which attributes, here named fields, the new layer will carry. You can skip that now, as new attribute fields can be added later.
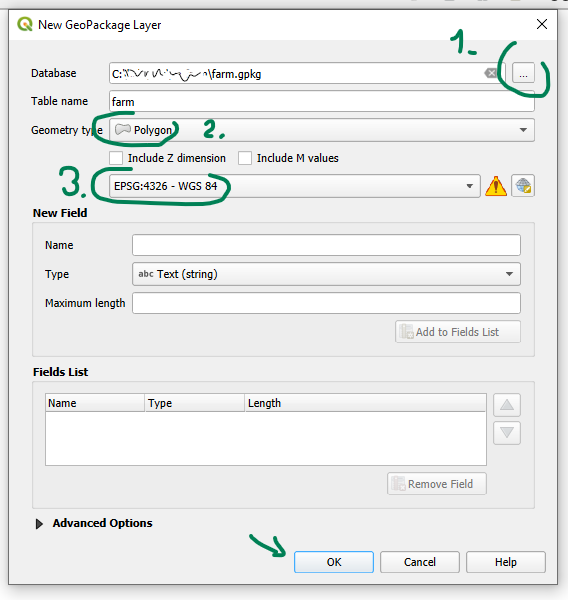
Creating a new vector layer in Geopackage format in QGIS.
If you intend to add new features based on some other layer like a basemap or satellite imagery, add the appropriate layer(s) now. A process of redrawing features into a vector layer from a raster layer is called a vectorisation.
A newly created layer contains no features. To add some features to the layer, you first have to toggle into an edit mode by clicking a pencil icon in the upper toolbar. In the edit mode, you can add new features, modify or delete existing ones. Only one layer can be edited at a time and it will be the one, which is selected (highlighted) in the Layers panel.
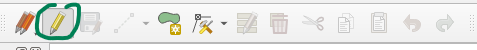
Toggle edit mode button in the toolbar, which is enabled at the moment.
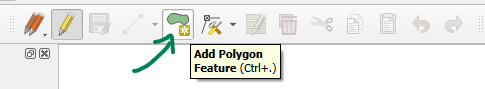
Once the edit mode is enabled, some new buttons are allowed in the same toolbar. One of them allows you to draw new features on the canvas. It is only possible to draw features with the geometry specified when the layer was created.
To draw a new polygon into your layer, zoom closer to your basemap and click on the locations in the map to draw a boundary of the desired polygon. The drawing is finished by right-clicking the mouse. QGIS then asks to enter an ID for the new feature (fid = feature ID). That is because every feature must have its unique identifier in the attribute table. If you leave the value “Autogenerate”, QGIS will assign trivial unique IDs to your new features once you save your edits.
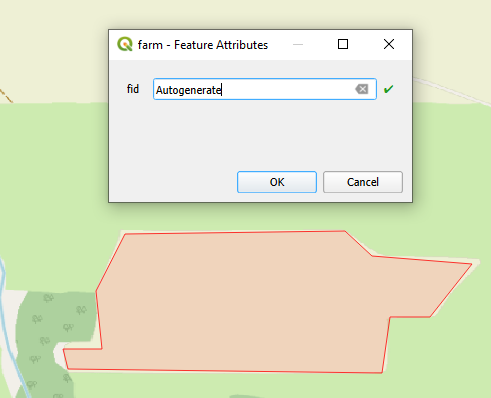
New feature created representing a field. Its ID will be assigned automatically when the edits are saved.
When you draw new features, they are not yet stored in your layer and are only temporary elements. To make your edits permanent, you have to click the diskette button in the editing toolbar. It will save your changes (additions, modifications or deletions) to the layer being edited. After saving your changes, you can either continue editing or you can toggle the edit mode again, if you have finished.
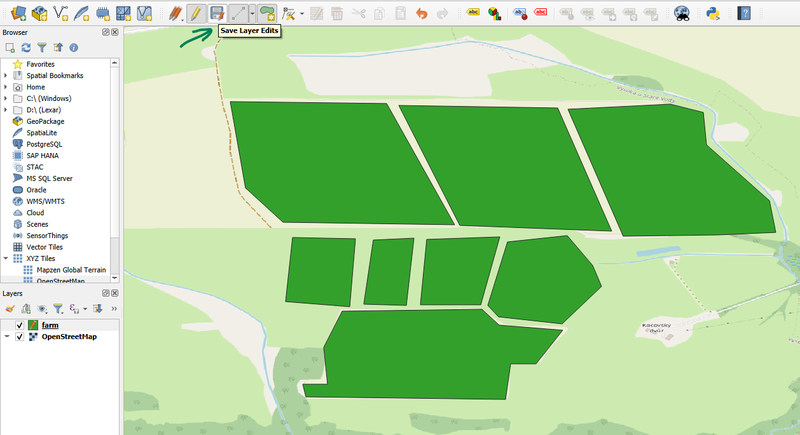
Several fields vectorised in the layer “farm” and displayed in the dark green colour above the OpenStreetMap basemap.
One of the very common operations in GIS when working with layers is to browse through the layer’s attributes. Attributes in GIS are displayed usually in an attribute table. This table represents each feature as one row in a table (also called a “record”) and the feature’s attributes in individual columns. Attribute tables are usually only available for vector layers, but QGIS also supports attaching an attribute table to raster data via a sidecar-file VAT.TBF.
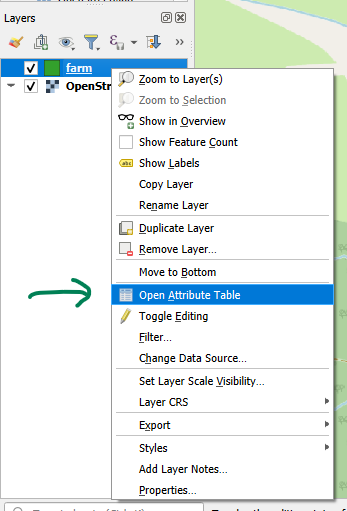
Opening an attribute table of a vector layer.
Attribute table gives you an option to browse through the attributes and see their values. You can also edit the attributes or make selections of the data. To edit values, add or delete columns or rows (features), you must again toggle into an edit mode. This is to prevent any accidental changes to your data.
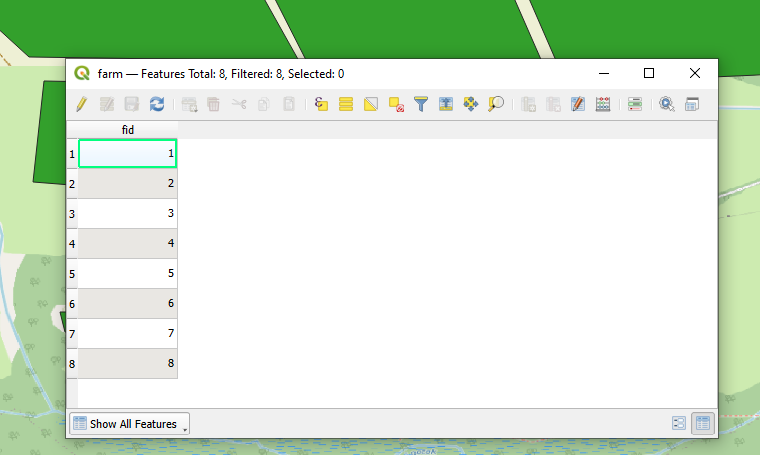
Attribute table for the newly vectorised layer is not very content rich. It only contains feature IDs.
Once you enter an edit mode you can add a new column into the attribute table by clicking the “New field” button.
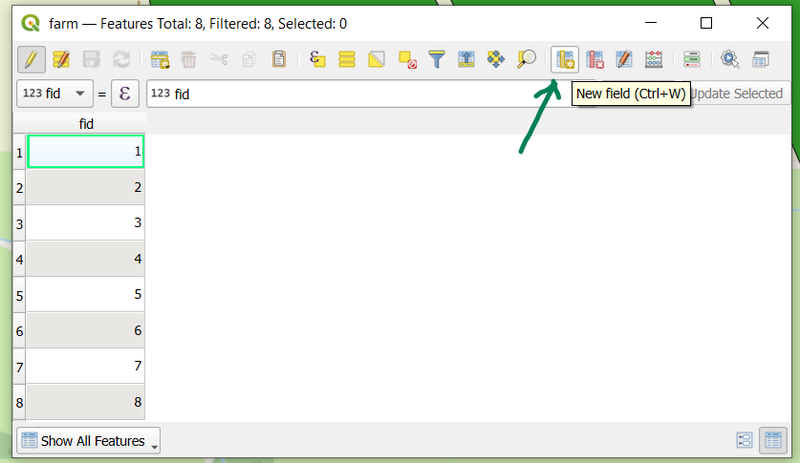
Attribute table in edit mode with “New field” button enabled.
When adding a new field, you must specify its name and its data type. Choose type “Text (string)” for textual data like descriptions, names or categories. Text data type must also be set with a maximum length the text can have. This is not possible to change later, so set the length with regard to expected values you will fill in the attribute. “Decimal number (real)” type is suitable to hold numeric values of any form including decimals, e.g. area, soil pH or average rainfall. “Integer (32 bit)” and “Integer (64 bit)” data types might be useful for numeric values which take integer values only, e.g. population, postal code or livestock count.
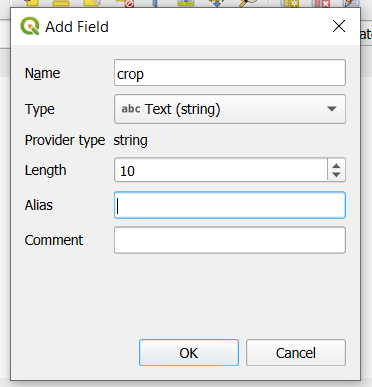
Adding a field for text attribute to specify a crop type.
When a new field is added, it is initiated with a value “NULL”. “NULL” is a special reserved value and means “no value” or “no data”. You can fill in the values by simply typing the desired values into the cells (provided you are still in edit mode). Once you are finished editing the attributes you must save your edits just like in the case of drawing / editing geometries. Then you can leave the edit mode.
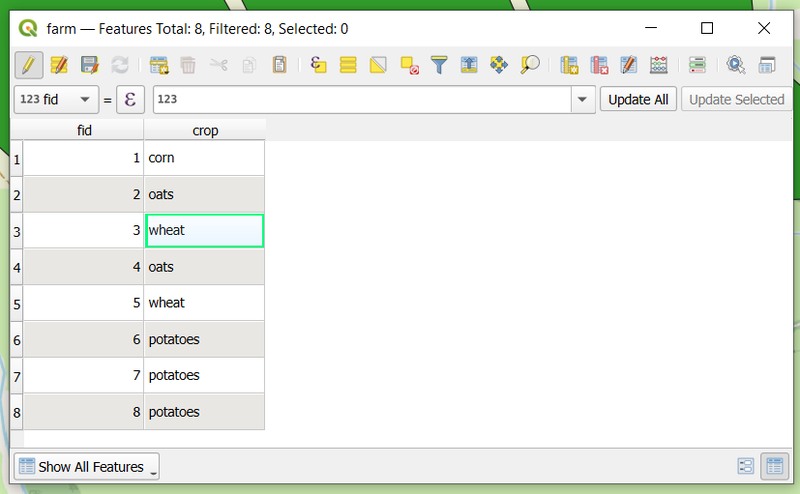
Attribute table for the vector layer “farm” with a “crop” attribute filled with values of a crop type. Each row represents one field in a farm.
Sources
Relevant online sources to start working with QGIS:
QGIS Training Manual: https://docs.qgis.org/latest/en/docs/training_manual/index.html https://www.qgistutorials.com/en/
Source for this lecture: OLAYA, Víctor. Introduction to GIS. 2018, CC-BY.