Introduction to GIS
Reading time
Content
GIS Terms
Information system (IS), in the computer world, is a system, which consists of people and computers that process or interpret information.
Geographic information system (GIS) is a computer-based system to analyse and present spatial data.
Data are facts and statistics collected together for reference or analysis.
Dataset is a collection of related data. Each entry within a dataset typically follows a consistent structure.
Spatial data refers to data which cover more than one spatial dimension (2D, 3D, …).
Geographic data (shortly geodata) are data representing features or phenomena related to the Earth.
Metadata are data that describe other data. They provide information about a dataset’s content, structure, source, and usage. In the context of geodata, metadata might include details like the data's creation date, the coordinate system used, data accuracy, scale, or descriptions of features.
Cartography is the study and practice of making and using maps. The process of surveying of geographical phenomena and creating a map is known as a mapping.
Visualisation is a graphical representation of information, making data easier to understand and interpret. In the context of data visualisation, it transforms raw data into charts, graphs, or images to highlight patterns, trends, and relationships. In cartography, visualisation is essential for creating maps that convey geographic data effectively, using symbols, colours, and scales to represent real-world locations and spatial relationships, helping users quickly grasp complex information about places and spatial patterns.
GIS in a Nutshell
A Geographic Information System is a system which consists of several components. These components work together to collect, analyse, and interpret spatial data, allowing users to make informed decisions based on geographic information. The key components of a GIS are:
- Hardware – physical equipment used to run GIS software, including computers, servers and GPS devices.
- Software – GIS applications that process, analyse, and visualise spatial data. Examples include ArcGIS, QGIS, Google Earth Engine etc.
- Data – the core of any GIS, including spatial data and attribute data, from sources like satellites, surveys, and databases.
- People – the users and experts who manage and analyse data within the GIS, ranging from GIS analysts to decision-makers.
- Methods – standardised procedures and models that guide data collection, analysis, and visualisation to ensure consistent, accurate results.
Some also include networks as another component. That means systems for sharing GIS data and applications across teams, such as cloud-based GIS, which enables collaboration and access to real-time data.
Getting Started with GIS Software
GIS software was traditionally only used on desktop computers, but recently mobile GIS and web-based GIS (webGIS) applications are gaining popularity.
There are five fundamental functionalities of a desktop GIS:
- data input and output,
- visualisation,
- editing,
- analysis and
- map design.
Most desktop GIS tools have these capabilities, although the level of functionality for each of them might differ. Some tools might be more prepared for data editing, while others might focus on analysis.
QGIS is a well-established, open-source GIS software. Being open-source software, it is freely accessible to all users.
To start using QGIS, navigate yourself at https://qgis.org/download/ and follow the steps relevant for your operating system. As of November 2024 the latest version was 3.40.
QGIS 3.40 start-up screen.
Once installed, start the QGIS application to investigate its user interface. After the application starts, you can change your locale setting under the “Settings” → “Options…” menu. When you start QGIS for the first time, you shall notice a blank white canvas. That is because there are no geodata to show yet. Work in QGIS is organised into projects. A project is a package of all the content in the map canvas and its settings – all layers, their symbology, rendering order, predefined print layouts etc. You know that your new project is not saved yet when you see the “Untitled Project” in the title of the QGIS window. When working on a project in QGIS, like in any other application, it is smart to save your work periodically so you don’t lose all your work in case of an accidental crash. You can save the project via “Project” → “Save” menu.
Untitled project is any new project which was not saved yet.
You can add a layer with geographical data into your project in several ways. One of them is to open the “Open Data Source Manager”.
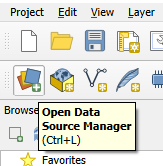
A button to open the “Open Data Source Manager”.
In the manager window, you first select the type of data you are about to open, then the location of the data and finally you can click the “Add” button and add the layer to your new project.
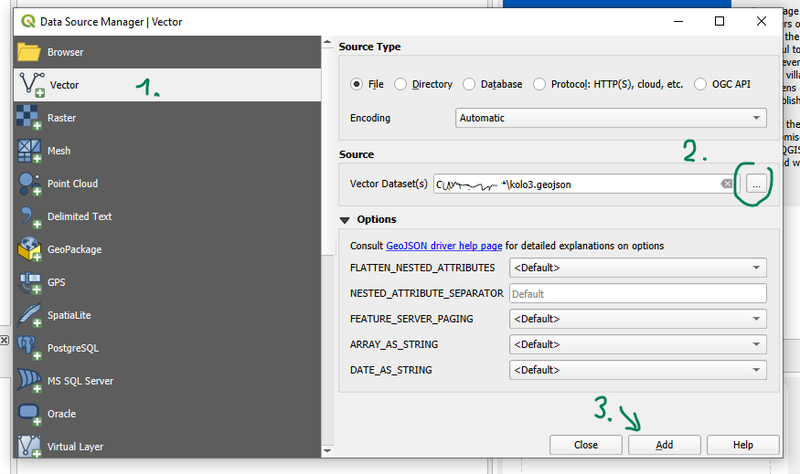
Open Source Data Manager window opening an existing vector layer.
The layer will appear in the “Layers” panel and its content will display in the map canvas.
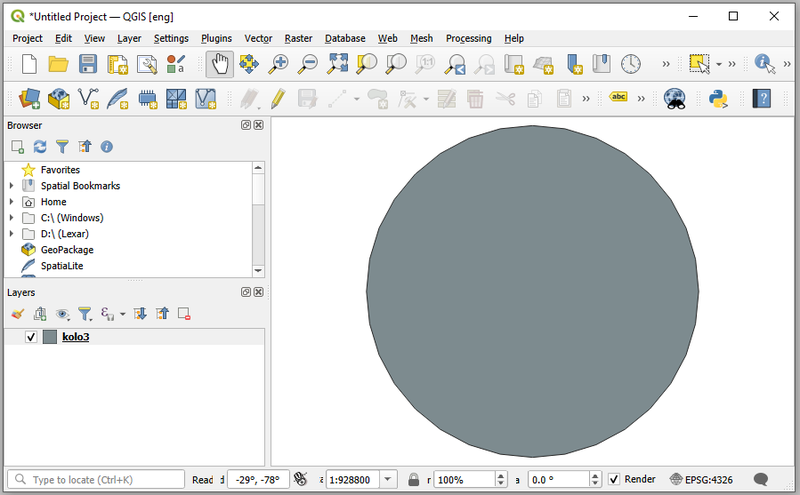
Unsaved QGIS project with one vector layer “kolo3”. There is only one feature in the layer, which is a circle (shown in grey).
Another option is to browse for layers in the “Browser” panel on the left side. Some external base layers can be also added quite quickly if you find the “XYZ Tiles” category and double click one of “OpenStreetMap” or “Mapzen Global Terrain” layers. The layer is immediately added to the Layers panel and in the map canvas. If you feel like the map is skewed or distorted in another way, this is due to the selected spatial reference system. You can learn more about various spatial reference systems and their properties in the course “Mapping fundamentals”.
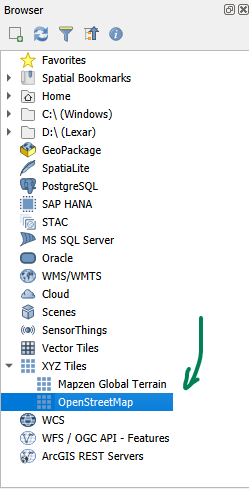
Adding an OpenStreetMap basemap from the browser window.
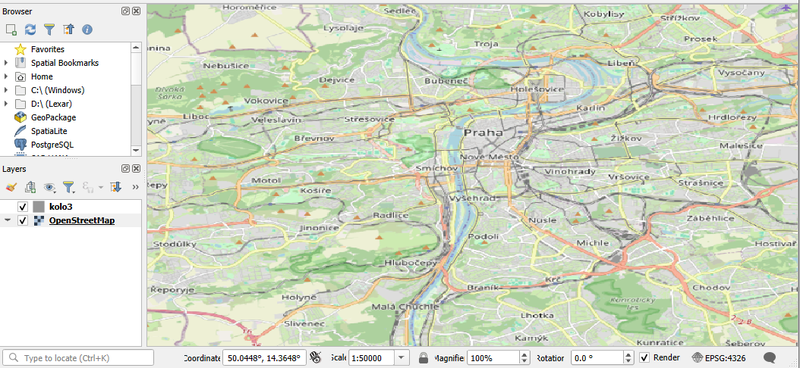
OpenStreetMap layer centred on Prague and zoomed to scale 1 : 50 000 in WGS84 spatial reference system. Layer “kolo3” is not in a visible extent now.
You can navigate in the map canvas with your mouse. Use panning to move the map and scroll the wheel to zoom in or out. More detailed overview of the QGIS interface can be found in the Lesson 2.1 of the QGIS Training Manual.
Relevant online sources to start with QGIS:
- QGIS Training Manual: https://docs.qgis.org/latest/en/docs/training_manual/index.html
- QGIS Tutorials: https://www.qgistutorials.com/en/