Tabular Data in GIS
Reading time
Content
In GIS, tabular data are non-spatial data organised in tables, providing additional context and information to spatial data. To fully leverage GIS, it’s important to connect tabular data (e.g. data in spreadsheets or databases) with spatial data, such as points, lines, and polygons on a map. This is usually done by linking an attribute table of geodata to an external table based on a common identifier, like a unique ID or name. For instance, a table listing cities with population data can be linked to a point layer representing city locations. Once linked, these attributes appear in the layer’s attribute table and can be displayed in the map, allowing users to visualise and analyse information like population density, area, or other characteristics directly with the spatial data.
Every spatial layer in GIS may have an attribute table that holds descriptive data about each feature in the layer. Attribute tables are organised in a familiar format like a spreadsheet, where each row represents a feature (e.g. a city or river), and each column represents an attribute (e.g. name, population, length).
Using queries, users can filter and analyse data within these tables. A query is essentially a search or filter applied to data based on specific conditions. For example, a query might isolate all cities with populations above 1 million. Queries make it easy to identify features that meet certain criteria, helping users answer questions.
Querying tabular data
An attribute query selects data based on specific values within an attribute table. It doesn’t rely on spatial relationships but rather on characteristics of the data itself, such as names, numbers, or categories. Attribute queries are similar to searching in a database or spreadsheet; you’re filtering rows that meet certain conditions.
Like in regular databases, SQL (Structured Query Language) is commonly used in GIS to perform attribute queries. SQL allows users to define specific conditions to find features that meet their criteria. For example, if you have a dataset of city locations with a "population" attribute, you could write an SQL query to find cities with populations over 1 million:
SELECT * FROM cities WHERE population > 1000000;
This query selects all rows from the "cities" table where the population is greater than 1 million, effectively highlighting these cities on the map.
Further analysis can be limited to these selected cities with at least 1 million population.
Unlike attribute queries, spatial queries use the geographic relationships between features to find data. Spatial queries answer questions like which features are close to each other, intersect, or fall within a certain area. Instead of filtering based on data values, spatial queries focus on where features are in relation to one another.
Examples of spatial queries include:
- Finding nearby features (e.g. all schools within 2 kilometres of a hospital).
- Identifying intersecting features (e.g. rivers that cross a particular county).
- Locating features within a boundary (e.g. all parks within city limits).
For example, let’s say we want to find all parks within a 5-kilometre radius of a city centre point:
SELECT * FROM parks WHERE ST_Distance(city_center.geometry, parks.geometry) < 5000;
Here, the query uses ST_Distance (a spatial function) to calculate the distance between the city centre and each park, selecting only those parks within 5,000 metres (provided the spatial reference system uses metres as its base unit).
GIS software like QGIS allows users to combine both attribute and spatial queries for more complex analyses. For instance, if we want to find parks larger than 50 hectares within a 5-kilometre radius of a city centre, we could use a combination of attribute and spatial conditions:
SELECT * FROM parks WHERE area > 50 AND ST_Distance(city_center.geometry, parks.geometry) < 5000;
This query selects parks that are not only within 5 kilometres of the city centre but also have an area greater than 50 hectares.
Querying data in QGIS
Tabular data in formats like CSV or Excel can be imported into QGIS. Using the "Join" function, these tables can be linked to spatial data by matching common fields, like a shared ID. Users can open the attribute table of any layer, add new columns, update values, or delete unwanted data. QGIS includes tools to query data by attribute. By using the “Select by Expression” or “Filter” options, users can apply custom filters based on expressions (e.g. finding all lakes larger than a certain area).
To make a query against a layer in QGIS, open the layer’s attribute table and locate the “Select by Expression” tool. This tool allows you to perform both attribute and spatial queries.
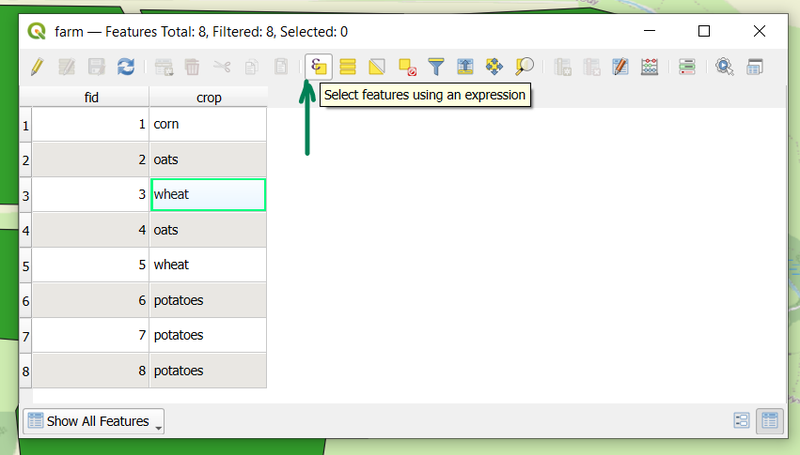
Attribute table of the vector layer “farm” and the “Select features using an expression” button highlighted.
You can either write the SQL query directly into the textarea on the left (marked with a letter “A” on the image), or you can construct the query by clicking the options on the right (marked with a letter “B” on the image). Under the “Fields and Values” option you can find the attributes of this layer. By selecting an attribute and clicking the “All Unique” button you can get a list of all unique values which the selected attribute takes.
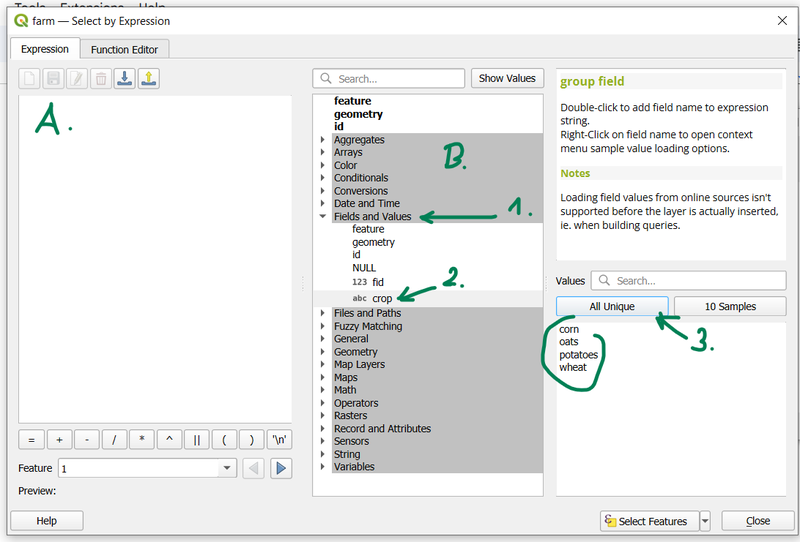
Select by Expression window showing four unique values (corn, oats, potatoes and wheat) of the attribute “crop” of the layer “farm”.
By double-clicking the attribute name, operators in the bottom left and the values in the list, you can construct a simple query like
"crop" = "wheat"
That query shall select all features with attribute “crop” equal to value “wheat”. That shall represent real-world wheat fields on the farm. The query is executed once you click the button “Select Features”.
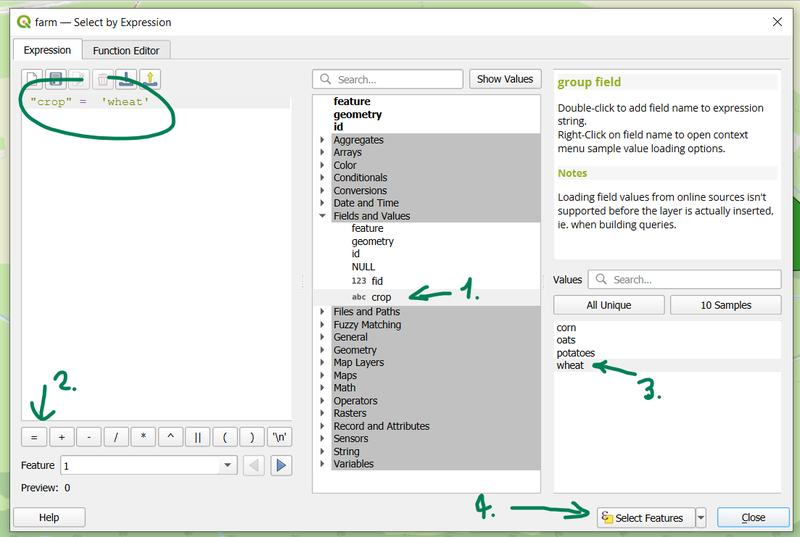
“Select by Expression” window with a query to select all wheat fields.
The selected features are highlighted both in the attribute table and in the map canvas. When the features are selected you can make further analysis with only the selected features, export these selected features or combine them with other layers and features. To deselect the features, click the “Deselect all features from the layer” in the attribute table toolbar or in the main toolbar of the QGIS application.
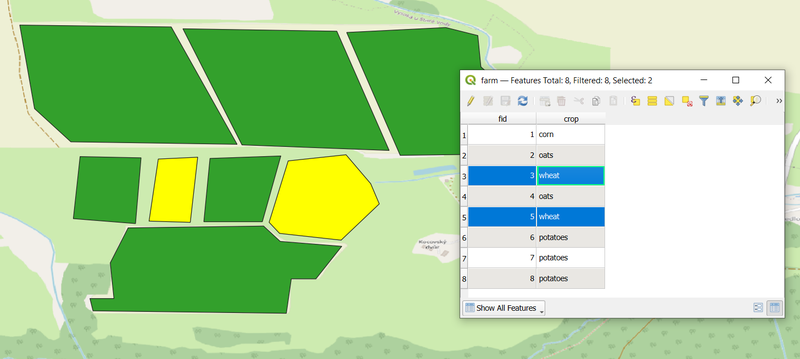
Wheat fields highlighted in the attribute table and in the map canvas.